
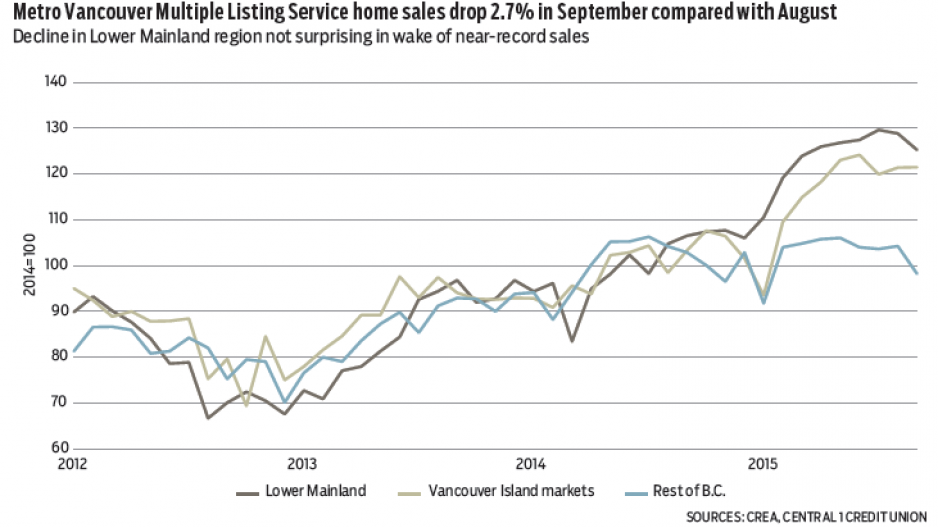
B.C. home sales continued at a brisk pace in September but dipped significantly from August, a potential signal of a cresting in sales momentum after a half-year uptrend. Multiple Listing Service (MLS) sales across the province reached a seasonally adjusted 8,300 units in September, down 2.9% from August. National sales fell by 2.1% over the same period.
Regionally, September’s decline was broad-based but was led by fewer sales in the Lower Mainland-Southwest (-2.7%), with Metro Vancouver contributing most to the decline. This downshift is not surprising given that sales have trended at near-record levels.
Despite the downshift in momentum, B.C.’s housing market continues to track at a high level. Unit sales in September were 12% ahead of the same month the year before and up 21% year-to-date. This compares with a 5% year-to-date gain nationally, which is being weighed down by sales declines in Alberta and Saskatchewan. B.C.’s growth remains well above gains in other provinces. Sales are up 10% in Ontario. While sales are up 15% in Prince Edward Island, the province represents only 0.3% of the national sales total.
B.C.’s housing market is expected to remain a growth driver for the economy, particularly in the south coast markets as low interest rates and stronger economic conditions drive housing demand. There is increased risk of a slowdown in Interior markets and northern B.C. as the spillover of Alberta’s recession and the effect of deteriorating emerging-economy growth on commodity prices hamper regional economic growth and the job market.
B.C.’s average home price dropped 2% to $619,840 but remained 5% above year-ago levels, driven by an average price decline of 4% in Metro Vancouver. However, average prices are influenced by a combination of factors, including real underlying price growth, regional sales share and sales composition within individual markets, and a closer look points to little evidence that underlying Metro Vancouver prices fell in September.
The MLS constant-quality housing price index (HPI) is a superior indicator of underlying price trends but is available for only select markets. Nonetheless, the HPI points to continuation of red-hot conditions in Metro Vancouver. Rather than declining prices, the HPI shows accelerated growth to an annualized pace of more than 20% as buyers chase a shrinking pool of inventory. Year-over-year, the HPI is up 12%, led by a 16% gain in single-detached housing, although gains in multi-family prices are also heating up.
Vancouver Island markets are also exhibiting strengthening price gains, with year-over-year HPI up about 5%. The HPI is unavailable for other B.C. markets but is consistent with our analysis of the economy; pricing conditions are mild. •
Bryan Yu is senior economist at Central 1 Credit Union.


