
Momentum slowed a bit in April, but B.C.’s housing market posted yet another strong month of activity, according to the latest numbers from the Canadian Real Estate Association (CREA). Total Multiple Listing Service residential sales climbed 0.7% from March to a seasonally adjusted 8,330 units – 24% above the same month in 2014. The market is clearly heating up, with sales levels unseen since the mid-2000s. A look across B.C. points to monthly sales gains across most regions. There was some pullback in the Okanagan, but this largely reflects some retracement after a February surge. B.C. compared favourably with the national performance, which posted monthly growth of 2.3%, but only 8.2% year-over-year.
April sales lifted year-to-date sales growth to about 24.5%. Other than northern B.C., which has observed lower sales from a year ago, sales are higher across the province. In particular, sales in the Lower Mainland are up over 30% and Victoria is showing a gain of 23.4%. The Okanagan markets and Kamloops sales are up 16%.
The sales uplift is not being met by gains in new supply. New listings fell for a second straight month and were down slightly from a year ago. The combination of rising sales and low flow of supply has dragged existing inventories (active listings) to the lowest point in nearly six years. Active listings are down 17% in the Lower Mainland, 12% in Victoria, 10% elsewhere on Vancouver Island, and down in most areas of the province.
We’ve all seen the headlines, but it is evident that the Vancouver area is a seller’s market, alongside Victoria. Other areas are generally at, or near, balance.
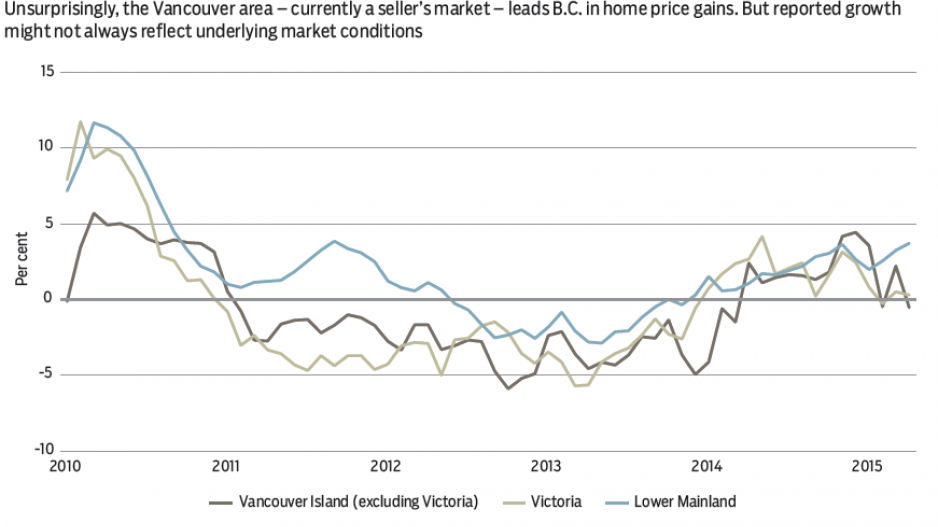
What happens when demand gets ahead of supply adjustments? Prices rise. The uptrend in B.C.’s average MLS price continued into April, up 0.6% on the month to a seasonally adjusted $622,680, and 13% above the same month in 2014. Gains are, unsurprisingly, being led by the Lower Mainland real estate boards. Greater Vancouver was up 12% while the Fraser Valley board area had a gain of 10%. That said, average prices are influenced by product composition, quality and geographic effects – as well as the inclusion of abnormally high-priced homes. As a result, reported growth may not always reflect underlying market conditions. This seems to be the case with the most recent numbers. CREA’s constant-quality price indices suggest underlying Lower Mainland prices are up about 4% from a year ago, although detached-home price growth is much stronger. While still elevated, and feeding into the average figures, broad price gains are not as strong as average figures suggest. •
Bryan Yu is senior economist at Central 1 Credit Union.


