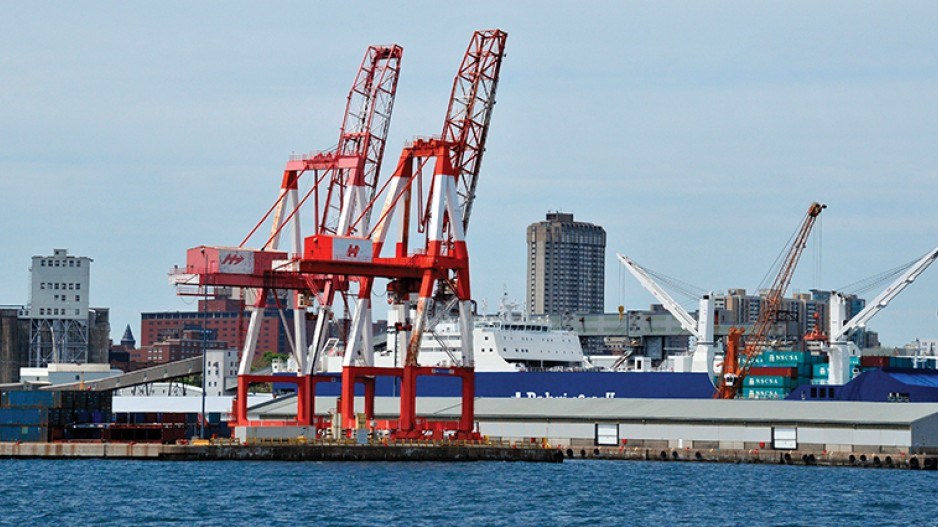
Growth in the amount of cargo handled at North America’s East and Gulf Coast ports was mixed in 2019, with Gulf of Mexico terminals enjoying higher increases of goods flow than their northern counterparts.
Thunder Bay
Cargo movement through the Port of Thunder Bay increased 6.9% in between 2018 and 2019 with 9.3 million metric tonnes (mt) moving compared with 8.7 million mt.
With 429 vessels calling in 2019 compared with 408 in 2018, Thunder Bay realized the cargo jumps in multiple areas:
•Grain: to 7.9 million mt from 7.4 million mt;
•Coal: to 779,893 mt from 702,695 mt;
•Potash: to 400,700 mt from 425,859 mt;
•Dry bulk: to 180,734 mt to 137,910 mt;
•Liquid bulk: to 16,317 mt from 35,485 mt and
•General cargo: to 19,364 mt from 31,335 mt
Hamilton/Oshawa
The Hamilton and Oshawa ports joined forces in June 2019 to create the Hamilton-Oshawa Port Authority, which makes cargo comparison from now-joint statistics difficult.
Port CEO Ian Hamilton said the amalgamation could attract more investment, and allow for bigger infrastructure improvements.
Regionally 2019’s results were slightly down from 2018, “when an extraordinary season saw a ‘perfect storm’ of bumper Ontario grain crops, while global trade wars caused surges in steel and agricultural commodity movements,” the port said.
“We can do very little to influence international trade wars, and we can do even less about the weather,” Hamilton said. “What we can do is make sure our ports are investing in trade-enabling infrastructure and expanding their capacity to handle more cargo.”
Halifax
Halifax cargo statistics are divided into Halifax Port Authority (HPA) non-HPA figures:
•Total HPA cargo volumes dropped to 4.45 million mt from 4.77 million mt;
•Containers dropped to 546,691 from 547,445;
•HPA containerized volumes dropped to 4.09 million mt from 4.37 million mt;
•Non-containerized volume dropped to 366,328 mt from 394,142 mt;
•Non-HPA non-containerized cargo fell to 4.165 million mt from 4.22 million mt
Montreal
Port of Montreal 2019 cargo stats were not available at press time.
New York
The Port of New York-New Jersey’s container cargo handling increased 1.5% to 5,231,418 loaded 20-foot-equivalent units (TEUs) in 2019 compared with 5,152,893 in 2018. Some 2,239,713 empty TEUs also moved through the port, up 10.5% from 2018’s 2,026,899.
Virginia
The Port of Virginia saw TEU movement increase 2.9% to 2,937,962 in 2019 from 2,855,904 in 2018.
Break-bulk dropped 14.7% to 161,489 short tons from 189,429. Total general cargo dipped by -0.2% to 21,940,748 short tons from 21,974,863.
Savannah
The Port of Savannah moved 4.6 million TEUs in 2019, an increase of nearly 250,000 or 5.6% compared with 2018.
In roll-on/roll-off trade, Georgia Ports Authority handled 657,685 car equivalent units (CEUs), trucks and tractors in 2019, a 2% increase over 2018’s total. Tonnage through all authority terminals reached 38.5 million, up from 36.9 million tonnes in 2018, a 4.3% rise. The increase is credited to steady volumes in break-bulk cargo, combined with growth in tonnage for both bulk and containerized goods.
Charleston
The South Carolina Ports Authority recorded its best results ever in 2019 handling 2.44 million TEUs, a 5% increase over 2018.
Break-bulk cargo grew with 725,828 tonnes handled, up nearly 10%.
Houston
2019 was a record-setting year for container volume for the Port of Houston as it posted a 34% increase compared with 2018. Numbers jumped to 2,987,291 TEUs from 2,227,710.
Houston is the Gulf coast’s biggest container port. It handles nearly 70% of regional container traffic.
Executive director Roger Guenther said Houston is well positioned to continue the upward trend in 2020.
“Expansion of the Houston Ship Channel and investments in our landside marine terminals are our top priorities,” he said.
Houston’s total tonnage breakdown for 2019:
•Containerized: 26,587,883 short tons (st) up to 29,043,107 st;
•Total general cargo: to 34,073,578 st from 31,652,700 st;
•General cargo steel: to 4,052,710 st from 4,363,788 st; and
•Bulk cargo: to 9,063,337 st from 9,210,586 st.
Houston handled more resins and plastics; fabrics, including raw cotton; chemicals and minerals; automotive; food and drink; steel and metals; apparel and accessories; hardware and construction materials and furniture.
Volumes of retail consumer goods; machinery; and appliances and electronics declined.
Corpus Christi
The Port of Corpus Christi saw significant growth in 2019, moving 122.2 million mt of cargo, an increase of 16 million mt. The port attributed the growth to a rise in exports of crude oil and liquefied natural gas. •


